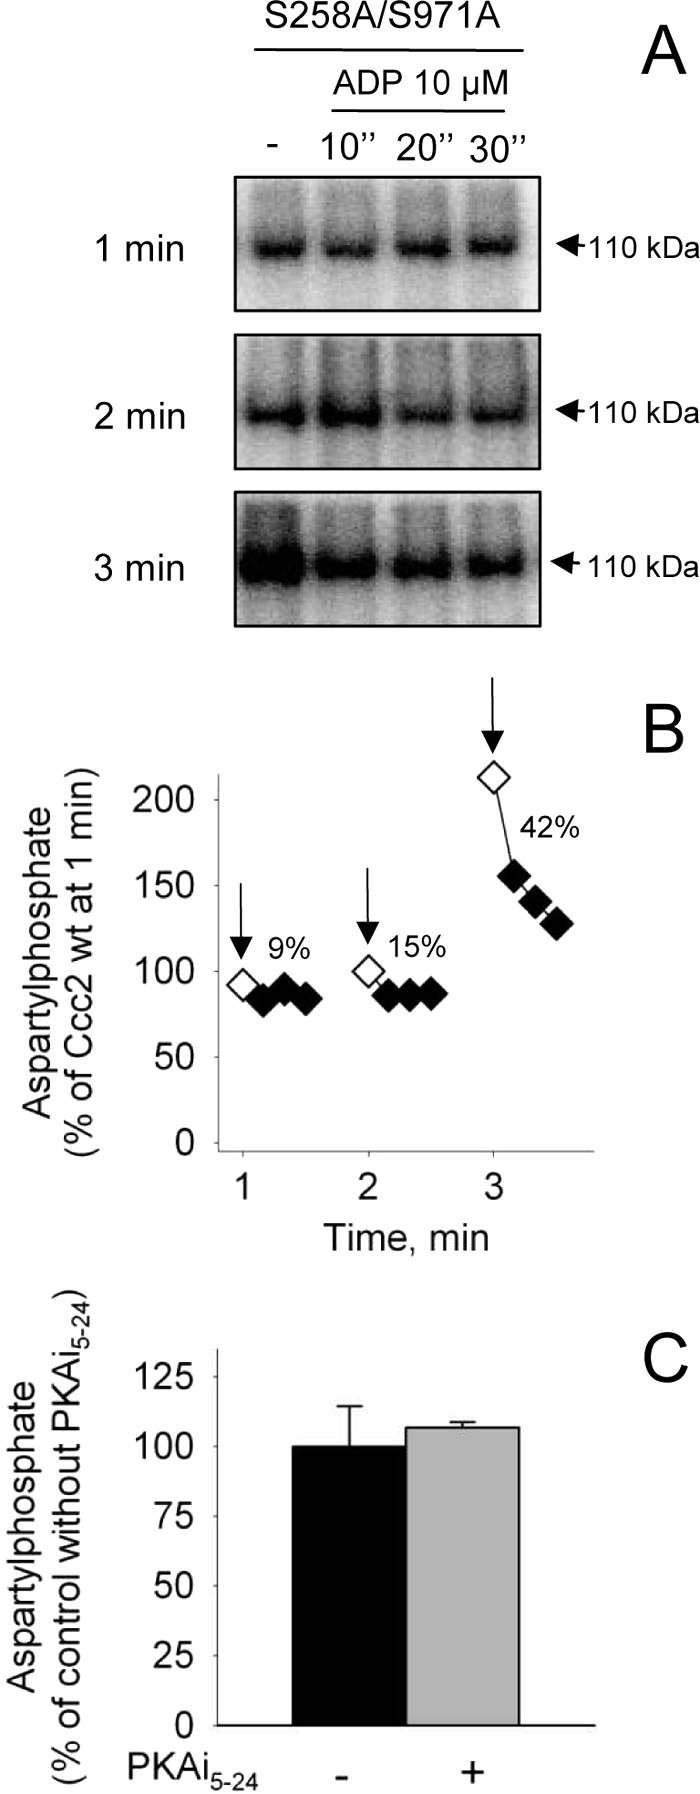
FIGURE 10.

S971A aspartylphosphate: time course of formation, ADP sensitivity, and influence of PKAi5–24. A, membranes of Sf9 cells expressing S971A were phosphorylated with [γ-32P]ATP at the indicated times. The autoradiogram depicts a representative experiment on the short time range scale (see inset). The autoradiograms in B with no ADP at 1, 2, and 3 min are representative of long time range phosphorylations. The figure presents the densitometric representation of six time course runs covering various time intervals (mean ± S.E.). The smooth curve was adjusted to the points by Equation 1 (see text). The inset depicts phosphorylation at shorter times for better visualization. The phosphoenzyme levels were normalized, taking phosphorylation of Ccc2 wt at 1 min as a reference (100%). B, representative autoradiograms obtained with membranes of Sf9 cells expressing. S971A that were phosphorylated by [γ-32P]ATP for 1, 2, or 3 min (arrows) and supplied with ADP for 10, 20 or 30 s. The figure presents the densitometric representation of three assays (mean ± S.E.). The decrease in phosphoenzyme (% of the corresponding level before ADP addition) corresponds to the ADP-sensitive CuE∼P. C, aspartylphosphate levels of S971A were measured at 1 min in the absence or presence of 1000 nm PKAi5–24.
