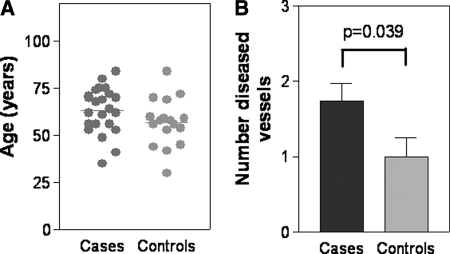
FIGURE 7.
Association with clinical coronary artery disease. A, a scatter plot of the ages of the patients in the group with no functional defects (controls) and the group with detected function defects (cases). The line represents the mean. B, a histogram showing the disease severity in each of the two groups. The number of diseased vessels ranges from 0 to 3. Both the number of patients in each group and the results of statistical analysis (Student's t test) are shown.

