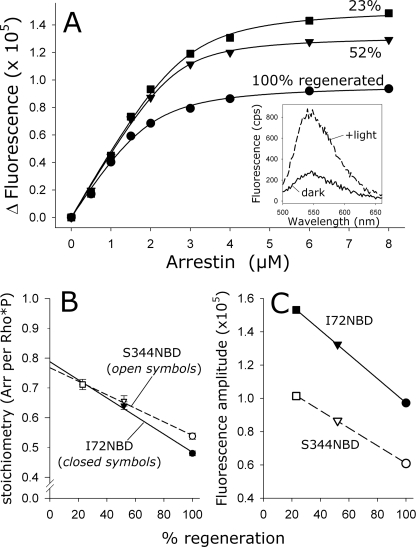
FIGURE 5.
Apparent arrestin-Rho*P binding stoichiometry was linearly related to the photoactivation density. A, arrestin I72NBD was titrated against 4 μm Rho*P at different photoactivation densities, which were achieved by using ROS-P membranes that were regenerated to different levels (100%, circles; 52%, triangles; and 23%, squares). Note that for each binding curve, the amount of activated receptor was the same (4 μm), although the amount of total opsP varied depending on the regeneration level. Inset, fluorescence was measured in the dark (solid trace) and after full photoactivation (dashed trace). The Δ Fluorescence represents the difference between the buffer-subtracted integrated fluorescence intensities of the dark and +light spectra. Fluorescence data were fit to binding curves (see Table 1). B, relationship between the photoactivation density and the stoichiometry, which was determined from the fitted binding curves. Data points represent the average of two independent experiments. Note that both fluorescently labeled arrestin mutants I72NBD (closed symbols) and S344NBD (open symbols) report nearly the same stoichiometry at each photoactivation density and the same linear dependence of stoichiometry on photoactivation density. C, relationship between the photoactivation density and the maximum fluorescence amplitude, which is directly related to the total amount of arrestin binding. Both I72NBD and S344NBD report the same linear dependence.

