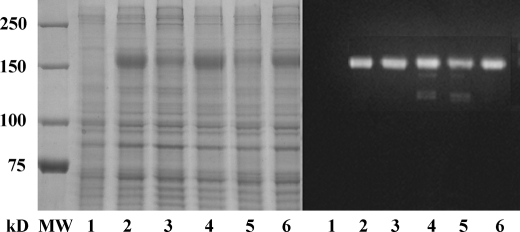
FIGURE 2.
Electrophoretic analysis (Laemmli) of microsomal fractions derived from COS-1 cells expressing WT and mutant ATP7B. The protein bands were stained with Coomassie Blue (left) or evidenced by Western blots obtained with antibodies against the c-myc tag in the expressed protein (right). Lane 1 was obtained with fractions derived from COS-1 cells infected with adenovirus vector carrying GFP cDNA (sham), lane 2 corresponds to WT ATP7B, lane 3 corresponds to the S478A/S481A/S1121A/S1453A mutant, lane 4 corresponds to the 6thCuNMBD mutant, lane 5 corresponds to the D1027N mutant, and lane 6 corresponds to the CuTMBS mutant. Note the different levels of expression, which were determined by chemiluminescence and taken into account to compare the stoichiometry of phosphorylation.

