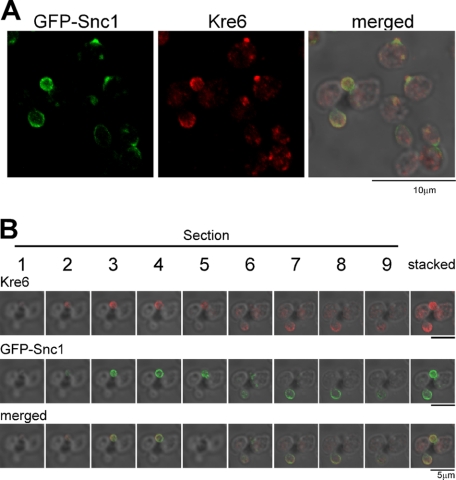
FIGURE 6.
Immunofluorescent images of Kre6 in comparison with the SV/PM-marker Snc1. The fixed cells with the chromosomal TPIpromoter-GFP-SNC1 gene were observed by immunofluorescent staining with anti-Kre6 serum and compared with fluorescent images of GFP-Snc1 of the same cells. A, cells in various cell cycle stages are shown. B, Section is the serial confocal slice image of each 0.25-μm depth from the surface to the slide glass, and Stacked is the sum of signals.

