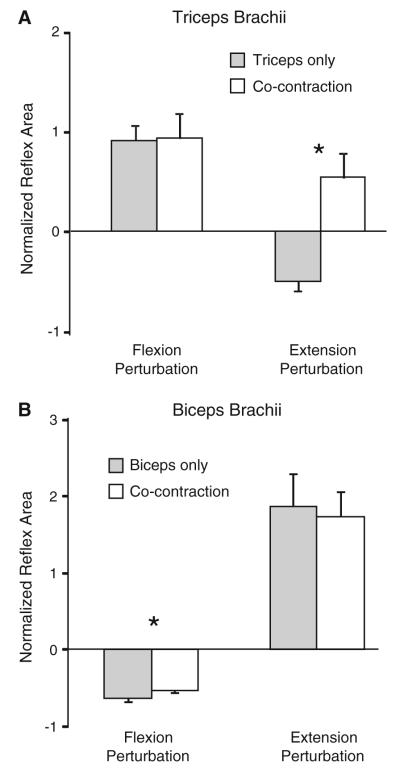
Fig. 2.
Group data (n = 15) showing reflex response size for the triceps (a) and biceps (b) muscles during elbow extension and flexion perturbations. Response size is shown as (reflex response area – background area)/background area. Filled bars indicate response size when the target muscle was pre-activated in isolation. Empty bars indicate response size when the BB and TRI were co-activated prior to the perturbation. Error bars represent one standard error of the mean. Asterisks indicates a significant difference between isolated muscle pre-activation and co-activation (P < 0.05)

