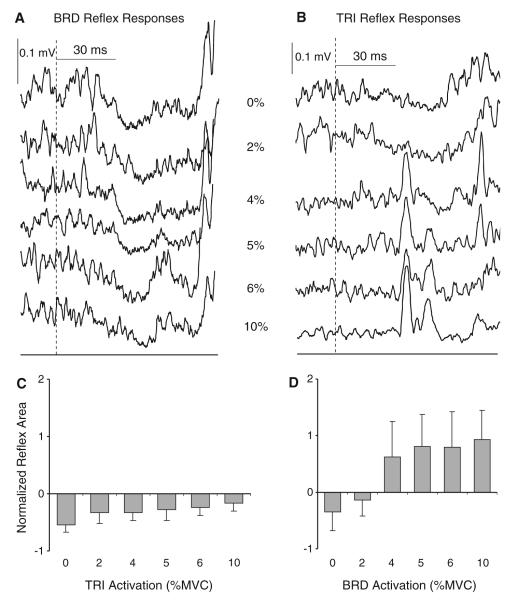
Fig. 5.
Example individual responses (a, b) and group averages (n = 9) of normalized reflex response size (c, d) in the brachioradialis (BRD) and triceps brachii (TRI) muscles during graded activation of the antagonist muscle. Responses in the BRD are shown on the left (a, c) and responses in TRI are shown on the right (b, d). The target muscle was always shortened by the perturbation and was always at 5% of maximum voluntary contraction (MVC). The centre column of a and b indicates the level of activation (% MVC) of the antagonist muscle for each trace. The onset of the joint perturbation is indicated by the dashed line. Error bars represent one standard error of the mean

