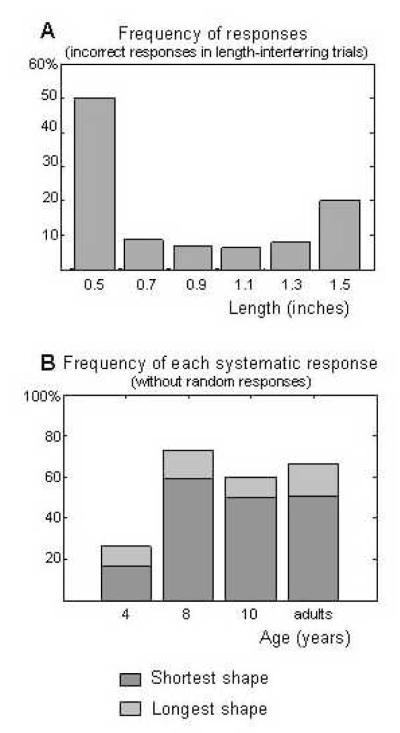
Figure 7.
Distribution of responses along the length dimension for angle and sense trials where length was allowed to vary. Only incorrect responses are included in this analysis, where we can clearly state that the responses were not driven by the dimension tested, but could have been driven by length instead. (A) Distribution of the responses for all the participants grouped together, for the 6 values of length presented in the interference trials. A certain proportion of responses appear to be random, and responses converged to either the smallest or the largest shape. (B) The distributions of responses were analyzed separately for each age group by means of a linear model fit, with regressors for random responses, smallest shape, and largest shape. The present graph shows the weight estimated for the smallest and largest shapes regressors, and therefore corresponds to how much more often these responses are given, compared to the other alternatives.

