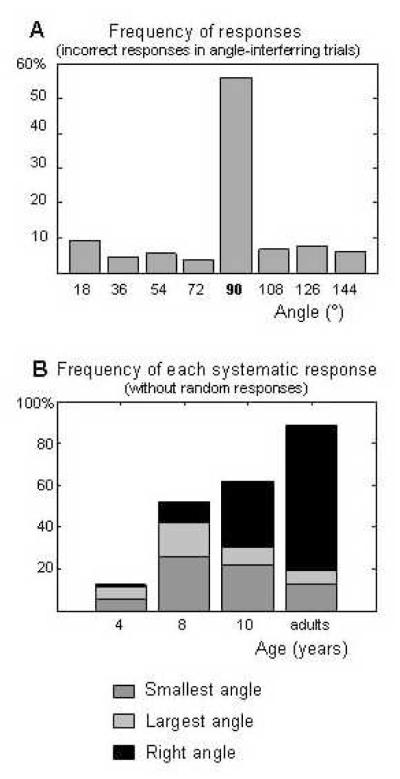
Figure 8.
Same analysis as figure 7, this time focusing on angle. (A) Distribution of the responses for each (absolute) value of angle, pooled across the 3 ranges of angle studied, for all participants. (B) Contribution of the regressors associated with the narrowest/widest/right angle, in a linear model fit to the responses (cf. figure 7).

