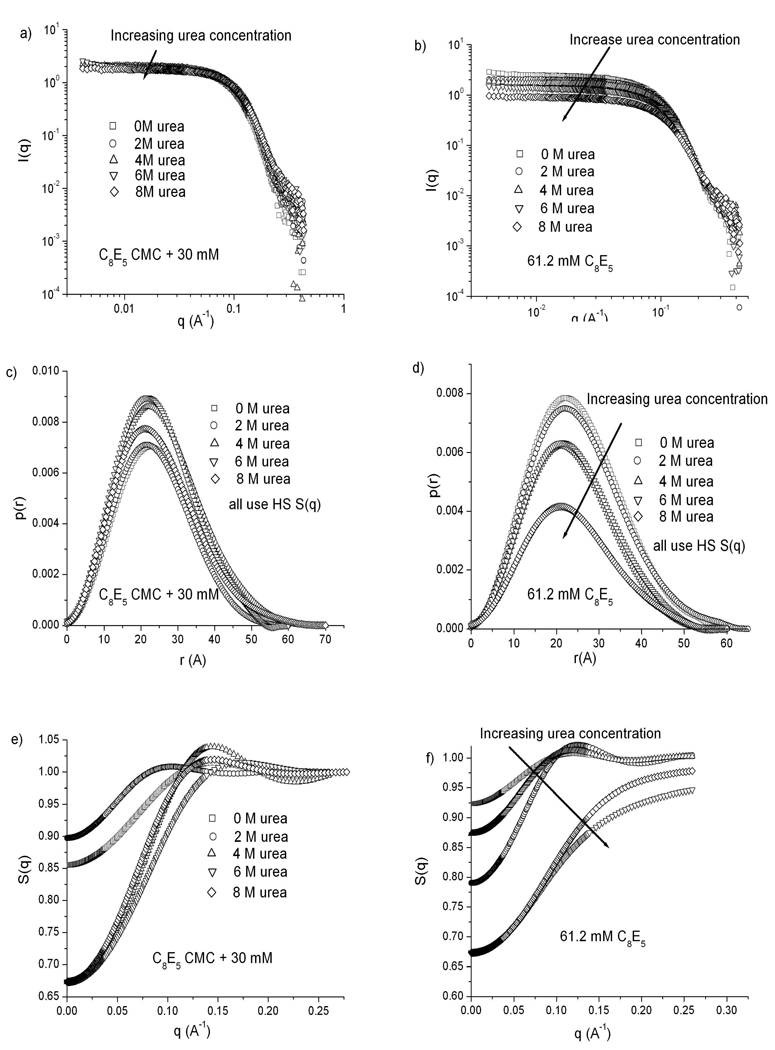
Figure 5.
SANS results for C8E5 micelles at urea concentrations of 0, 2, 4, 6 and 8 M. a), c), e) C8E5 concentration kept at 30 mM above the CMC at each urea concentration. b), d), f) C8E5 concentration fixed at 61.2 mM. a), b) Scattering spectra. c), d) p(r) curves calculated from each scattering spectrum. e), f) Structure factors calculated for all samples using the hard sphere potential (note expanded scale).

