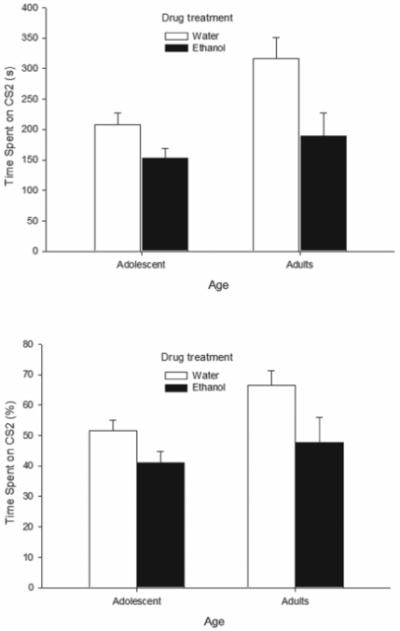
Figure 4.

Total time (s) spent in the sandpaper lined chamber (CS2, top panel) and the corresponding percent preference for the chamber (bottom panel) during the 12 min test session after three first-order conditioning sessions. Data are plotted as a function of drug treatment during conditioning (ethanol or water) and age of the subjects (adolescence or adulthood). Data were collapsed across sex (male or female). The sex factor did not exert a significant main effect or significantly interact with the remaining variables. Vertical bars indicate the standard error of the mean.
