
Fig. 3.
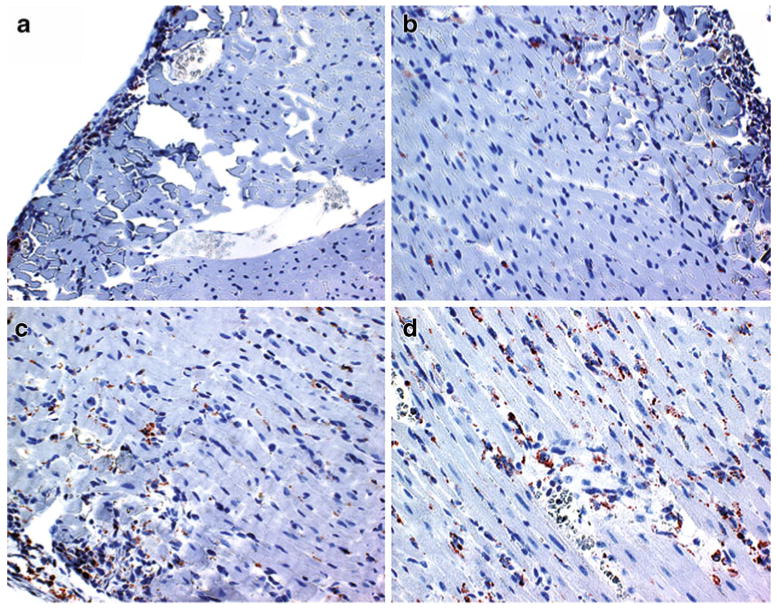
Temporal progression of ED1+ macrophage infiltration. Optical micrograph (400× magnification) of anti-rat ED1+ immunohistochemical staining sections of allograft hearts obtained on POD 3 a, POD 4 b, POD 5 c, and POD 6 d. The ED1+ cells appear to be brown and the background is counter-stained blue. (From Wu et al. [25•]; with permission)