
Fig. 7.
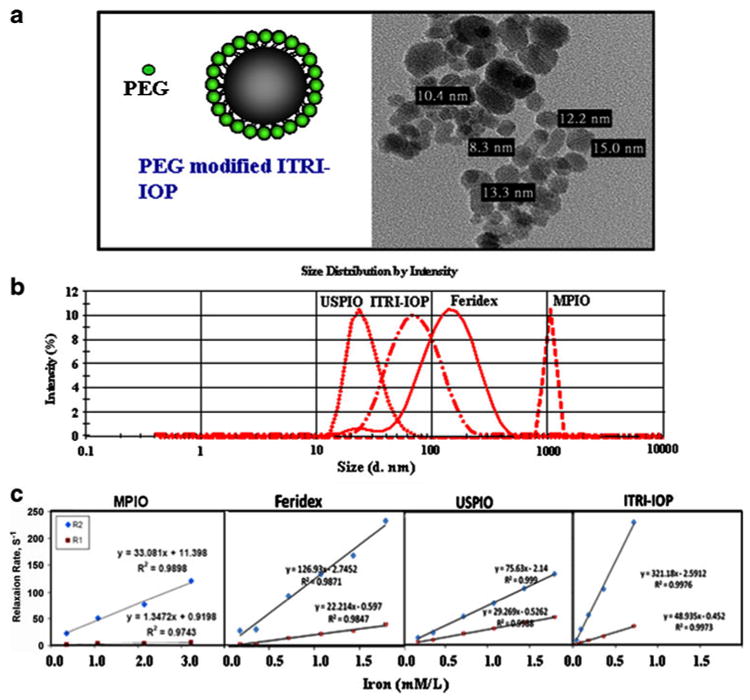
Characterization of ITRI-IOP. a Schematic drawing of the PEG-coated ITRI-IOP, and the TEM image of the iron core of the ITRI-IOP particles. b Dynamic light scattering analysis of the hydrodynamic diameter of iron-oxide particles. Peak intensity is provided for each distribution of particles. c r1 and r2 relaxivity measurements of four iron-oxide particles diluted in distilled water with iron concentrations between 5–180 μg/mL. The longitudinal and transverse relaxation rates R1 (1/T1) and R2 (1/T2) are linearly fitted against iron concentration. The slopes of the linear fitting are the longitudinal and transverse relaxivities, r1 and r2, of the particles, respectively. (From Chen et al. [48]; with permission)