
Fig. 9.
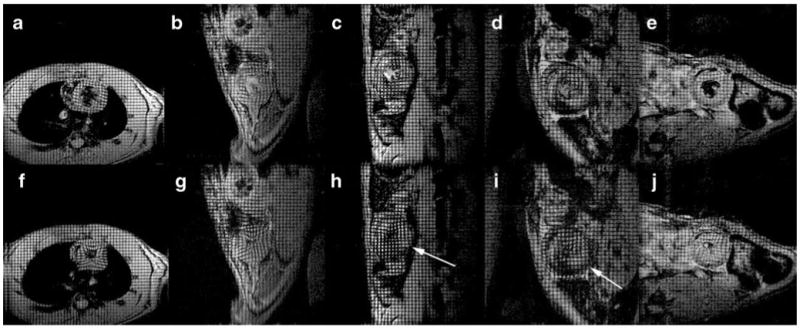
MRI tagging. Tagged images for a native heart (a, f), and the same transplanted hearts shown in Fig. 4 (see Wu et al. [22•]). b, g is the same isograft shown in Fig. 4a; c, h is the allograft shown in Fig. 4c; d, i is the allograft shown in Fig. 4d; and e, j is the allograft shown in Fig. 4e. Top panels a–e: ED; lower panels f–j: ES. Some areas with compromised wall motion are identified with arrows. Some areas with USPIO infiltration can be seen as dark regions. Anatomical structures are not labeled for clarity. (From Wu et al. [22•]; with permission)