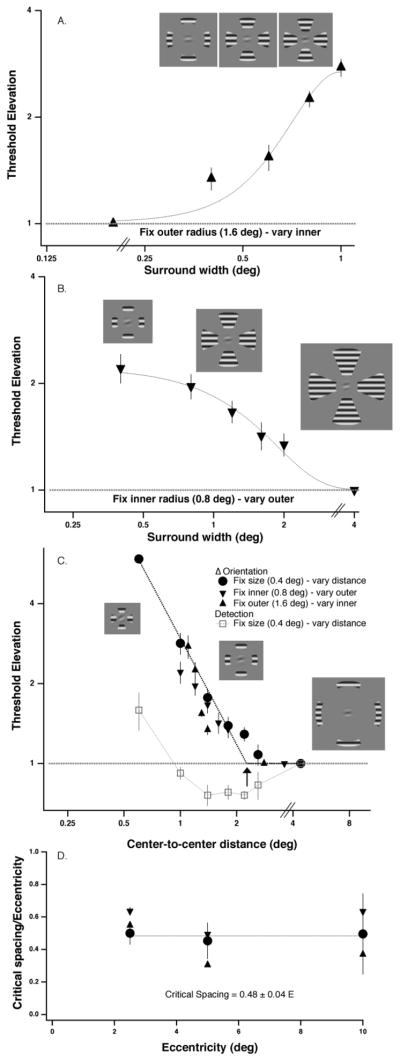
Fig. 1.
A. Fixing the position of the outer edge of the flanks (at 1.6 deg), and increasing the size of the flanks by varying the inner radius results in increased crowding (threshold elevation). B. Fixing the position of the inner edge of the flanks (at 0.8 deg), and increasing the size of the flanks by varying the outer radius results in decreased crowding. C. Fixing the flank size and increasing the center-to-center distance results in decreased crowding (red circles). The individual threshold data are shown in Fig. S1. Replotting A and B in terms of the flank center-to center distance superimposes the 3 data sets. The dotted line is a 2-line fit to the data. We define the critical spacing as the point of intersection of the two-lines. Open squares show that except at the closest distance where target and flanks overlap, flankers reduce detection thresholds (i.e. facilitate detection of the target). D. Critical spacing specified as a fraction of the target eccentricity for each of the three experiments at eccentricities of 2.5, 5 and 10 degrees in the lower visual field.

