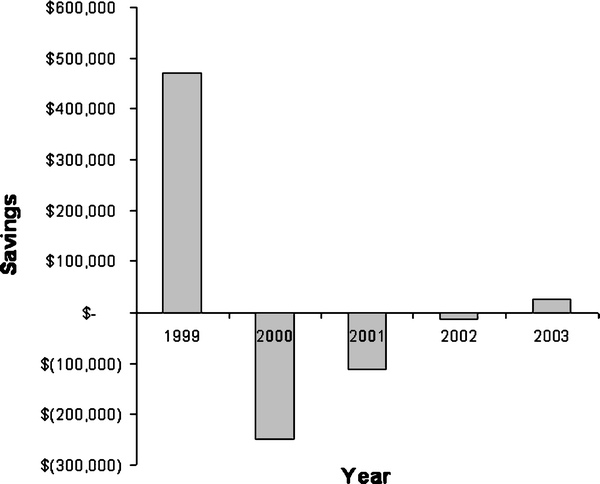
Fig 1.

PACS cost savings from 1999 to 2003. The cost savings were maximized in 1999 at close to $480,000. This was followed by three successive years of overexpenditures followed by some small savings in 2003. The initial savings represented an immediate halt in spending on budgeted items. The period from 2000 to 2003 represented increasing savings being offset by greater than expected expenditures.
