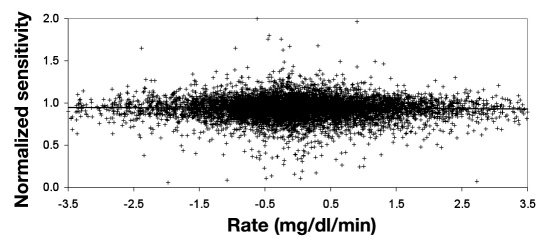
Figure 2.
Normalized sensitivity for BG tests that meet screening limits for calibration as a function of rate (n = 8584). The line is a nonstatistically significant linear regression (p = .060) and represents a calibration bias of ±0.8% for rates of ±3.5 mg/dl/min. The sensitivity check makes it very unlikely that the outlier values in this plot would be used for calibration.

