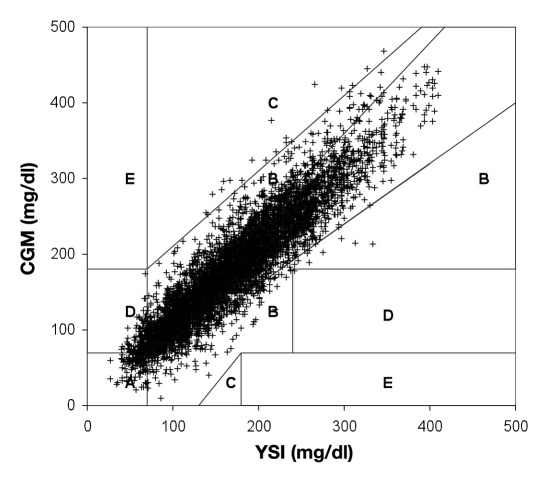
Figure 4.
Point EGA of the FreeStyle Navigator CGM clinical data. Zone A represents clinically accurate (80.3%); zone B represents benign or no treatment errors (18.0%); zone C represents overcorrection errors (0.2%); zone D represents a potentially dangerous failure to treat (1.5%); and zone E represents erroneous treatment (0.0%). A slight modification of the Point-EGA was made for the purposes of this figure. Normally the ranges of the grid are adjusted for rate. To fit all points onto one grid, the adjustments to the grid were applied to the data points instead. For example, when the rate is 1–2 mg/dl/min, appropriate zones of the grid are adjusted by -10 mg/dl; for the purposes of this figure, the CGM glucose was adjusted by +10 mg/dl instead. This modification was only used for this figure; the CG-EGA data presented were performed as the analysis was described in the original publication.

