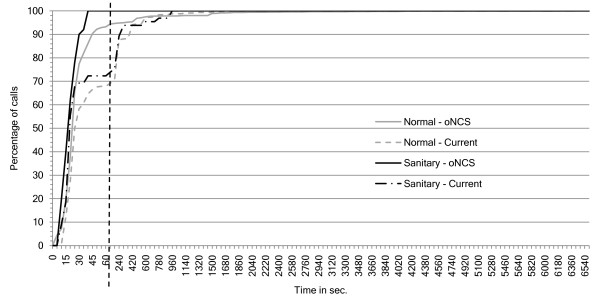
Figure 14.
Percentage of normal and sanitary calls as a function of the nurse arrival times. This figure shows the percentage of normal and sanitary calls (y-axis) as function of the arrival times of these nurses (x-axis in seconds) for both the oNCS system and the current, place-oriented system. This means that the nurse has arrived at the place where the patient made the normal or sanitary call. Note that the first part of the x-axis has a time-step of 5 seconds, while the second part has a time-step of 60 seconds. The two parts are separated by the striped vertical line.

