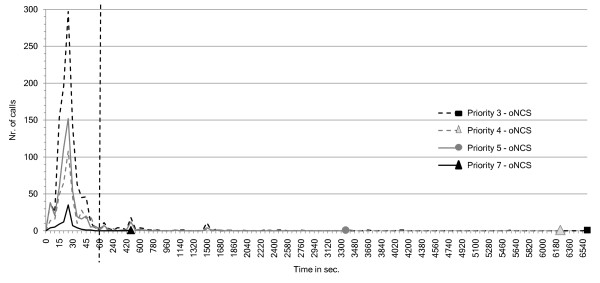
Figure 15.
oNCS system: number of calls as function of nurse arrival times for different call priorities. This figure visualizes the number of calls that have a nurse present (y-axis) as function of the arrival times of these nurses (x-axis in seconds) for different call priorities for the oNCS system. This means that the nurse has arrived at the place where the patient made the call. This allows evaluating (1) the influence of the priority of the call on the arrival time of the nurse (2) the distribution of the calls amongst the different priorities. Note that the first part of the x-axis has a time-step of 5 seconds, while the second part has a time-step of 60 seconds. The two parts are separated by the striped vertical line.

