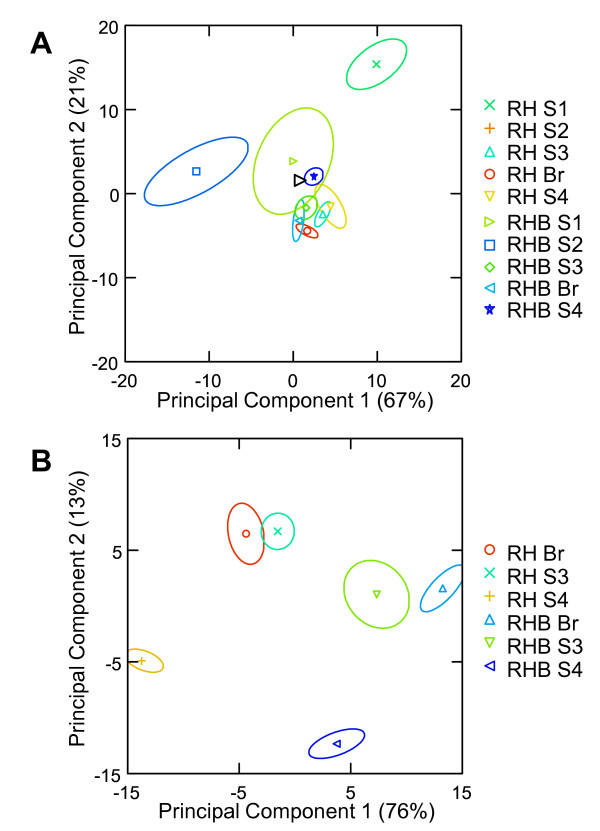
Figure 6.
Principal component analysis of GC-MS data from RHB and RH genotypes. The various stages are represented with different symbols. The variance explained by each principal component is represented within parentheses. A: PCA of all samples (5 stages). B: PCA of late ripening stages S3, Br and S4.

