
Figure 2.
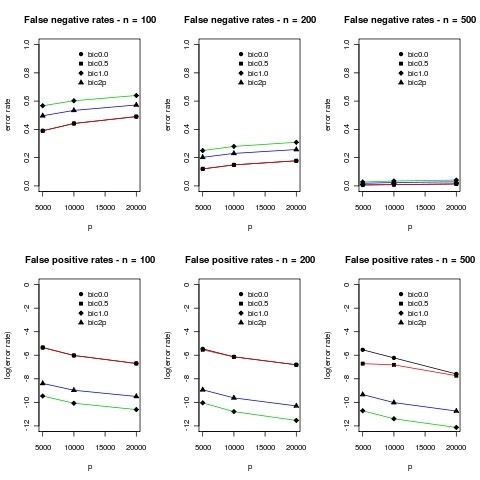
Results of simulations for m = 5. Mean error rates over 10 simulations are plotted. The standard deviations were typically less than 5% and difficult to distinguish on the plots so they were omitted. In the plots bic0.0 corresponds to γ = 0 in (7), bic0.5 to γ = 0.5, bic1.0 to γ = 1.0 and bic2p corresponds to BIC defined by equation (8). We use a log scale for the false positive rates because the number of zero entries is so large that it is difficult to make sense of the numbers in the original scale.