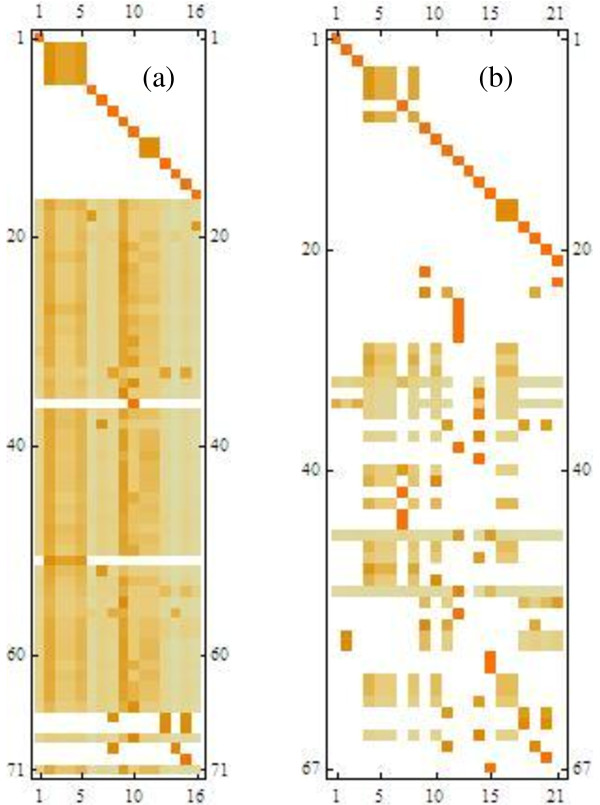
Figure 1.
DAG matrix for demo network. Non-zero columns of the DAG matrix (a) with only structural externals recognised (b) after reclassifying 4 high connectivity internals as external. Colour scaling expresses random walk probabilities between source nodes (rows) and sink nodes (columns) of the network; comparison of (a) and (b) shows how connectivity structure is revealed by an appropriate high connectivity cutoff.

