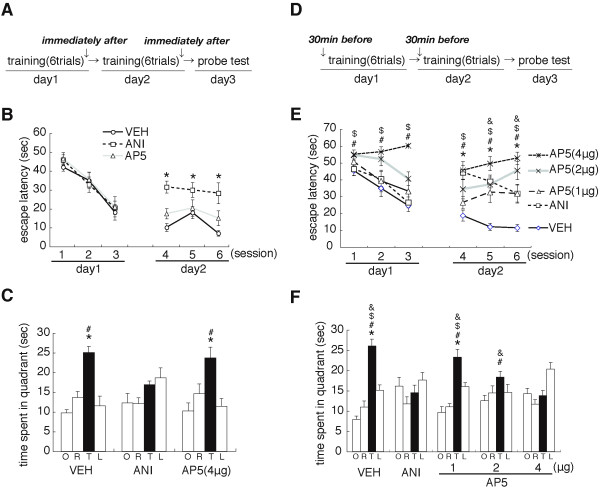
Figure 1.
Roles of protein synthesis and NMDAR in the hippocampus in spatial learning and memory. (A) Experimental design. (B) Escape latencies during training [VEH, n = 7; ANI, n = 8; AP5 (4 μg/μL), n = 9]. *P < 0.05 compared to the VEH-infused group at each block. Data are indicated in blocks of 2 trials. (C) Probe trial at day 3. *P < 0.05, comparisons of searching scores in the TQ vs. time spent in the other quadrants by post hoc Newman-Keuls test after significant one-way ANOVA. #P < 0.05, comparisons of searching scores in the TQ with ANI-infused group. (D) Experimental design. (E) Escape latencies during training [VEH, n = 11; ANI, n = 10; AP5 (1 μg/μL), n = 11; AP5 (2 μg/μL), n = 10; AP5 (4 μg/μL), n = 11] *, &, #, $ P < 0.05, ANI-, AP5 (1 μg/μL)-, AP5 (2 μg/μL)-, and AP5 (4 μg/μL)-infused groups, respectively, were compared to the VEH-infused group at each block. (F) Probe trial at day 3. *P < 0.05, comparisons of searching scores in the TQ vs. time spent in the other quadrants by post hoc Newman-Keuls test after significant one-way ANOVA. &, #, $P < 0.05, comparisons of searching scores in the TQ with ANI-, AP5 (2 μg/μL)- and AP5 (4 μg/μL)-infused groups, respectively. Error bars are SEM. Time spent (s) in target (T), adjacent left (L), adjacent right (R), and opposite (O) quadrants during the probe trial is shown.

