
Figure 11.
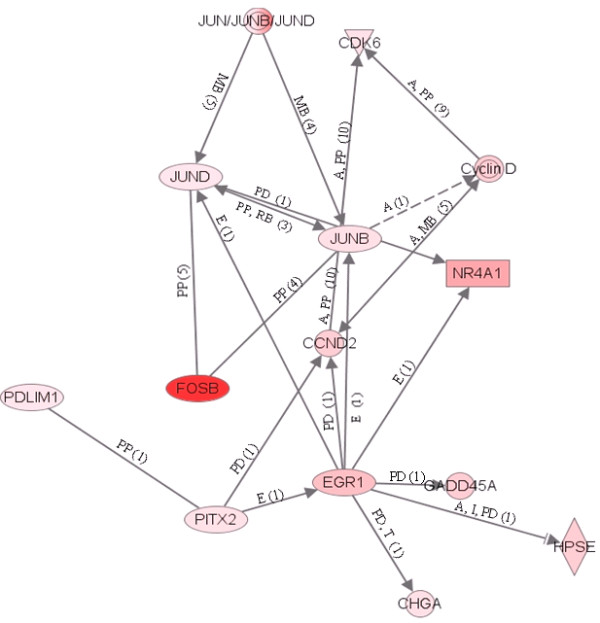
An example of a gene network, showing the relationships between molecules identified by the microarray and over expressed in CCs cultured with the enclosed oocytes relative to those cultured without. The type of the association between two molecules is shown as a letter on the line that connects them. The number in parenthesis next to the letter represents the number of bibliographic references currently available in the Ingenuity Pathways Knowledge Base that support each one of the relationships. Direct or indirect relationships between molecules are indicated by solid or dashed connecting lines, respectively. P = phosphorylation, A = gene activation, E = increase in expression, PP = protein-protein interaction, PD = protein-DNA binding, MB = membership in complex, LO = localization, L = proteolysis, RB = regulation of binding