
Figure 20.
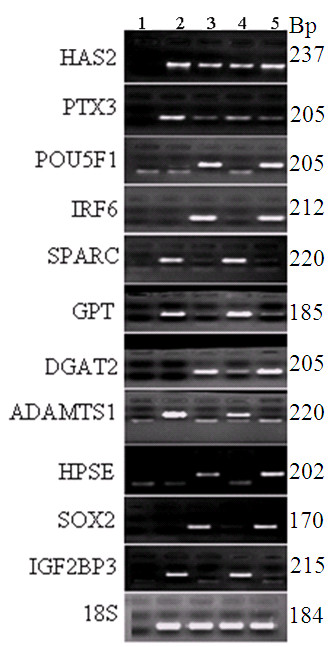
Validation of the microarray data by semi quantitative RT-PCR. A 2% agarose gel electrophoresis depicting the mRNA expression of genes that are exclusively expressed either in oocytes or CCs. Number 1 shows a negative control (dd water as a template) and 2, 3, 4 and 5 show the abundance levels of each transcript in MII CCs, MII oocytes, GV CCs and GV oocytes, respectively. 18S was used as a loading control for total RNA.