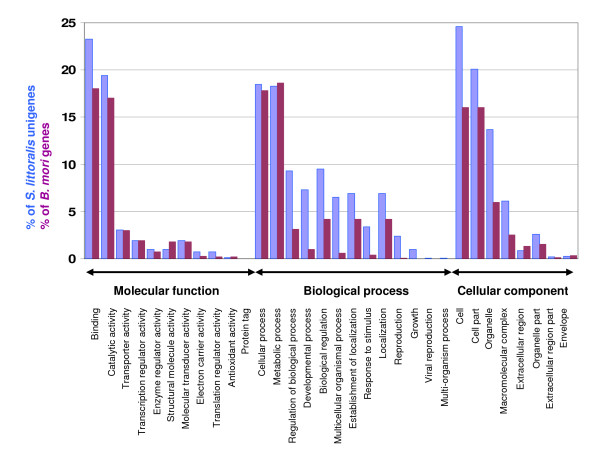
Figure 3.
Distribution of S. littoralis unigenes annotated at GO level 2 and comparison with annotated B. mori unigene distribution. The Y-axis shows the percentage of the sequences. The X-axis shows three areas of annotation, and in each area the sequences are further divided into subgroups at GO level 2. B. mori GO terms were retrieved from http://www.silkdb.org/cgi-bin/silkgo/index.pl

