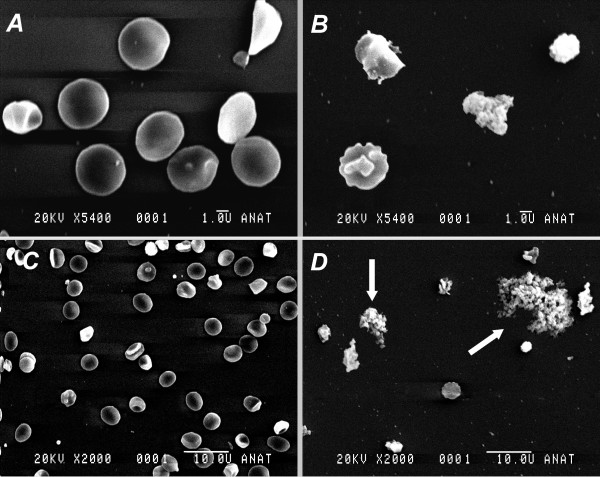
Figure 2.
Scanning electron microscopy of native platelets (panels A and C) and platelets from blood after 40% dilution HyperHaes (panels B and D) in 5400fold (panels A and B) and 2000fold (panels C and D) magnification. Representative scans demonstrate deformed platelets, spreading activated platelets (panel B), as well as large aggregates of activated platelets (arrows in panel D). Note small bars on the lower right side of each panel indicating length of 1.0 U = 1 μm (panels A and B) and 10.0 U = 10 μm (panels C and D), respectively.

