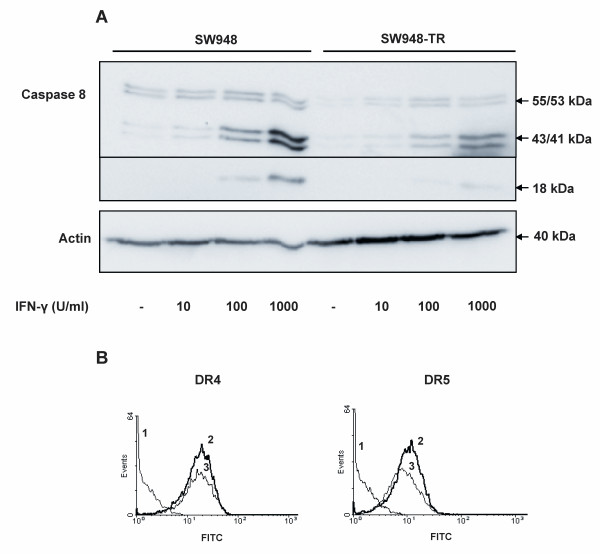
Figure 6.
Increase in caspase 8 levels following treatment of SW948-TR cells with IFN-γ. A: Effects of 48 h incubation with increasing concentrations of IFN-γ on caspase 8 levels in SW948 and SW948-TR. B: Effects of IFN-γ on DR4 (left figure) and DR5 (right figure) membrane expression as determined by flow cytometry. Receptor expression was detected as the average antigenic density of the whole cell population and resulted in a peak shift to the right. (1 = control; 2 = basal DR4 or DR5 membrane expression level; 3 = DR4 or DR5 expression after exposure to 1000 units (U)/ml IFN-γ for 48 h).

