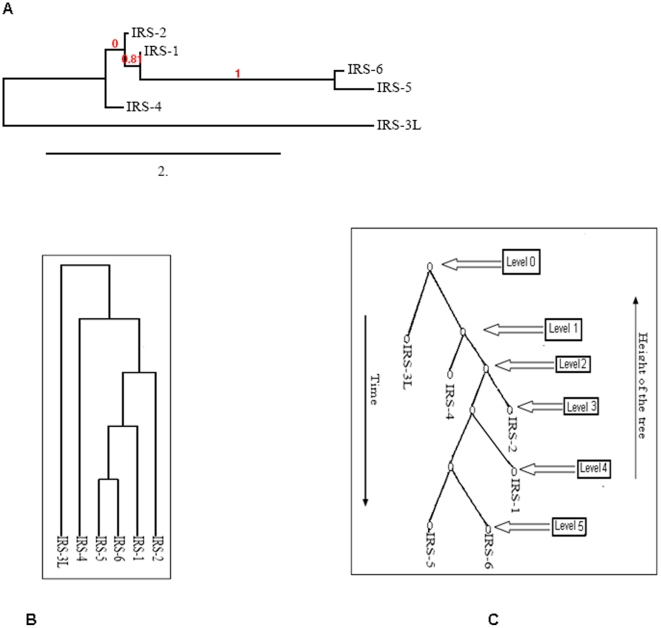
Figure 2. Phylogenetic tree construction.
(A) Phylogram tree with the distances between the protein sequences of the IRS family members. Bootstrap support values are indicated at nodes. IRS protein family members names at the clade. (B) Cladogram of protein sequences of the IRS family members for tree algorithm analysis (C) Representation binary tree equivalent to Cladogram.

