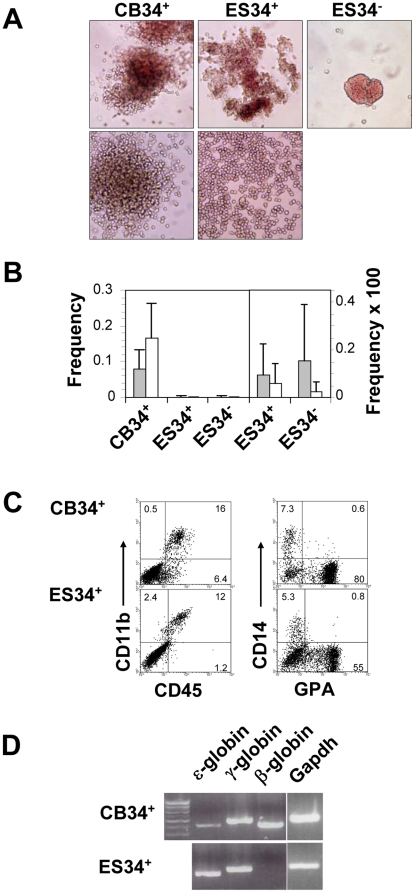
Figure 2. Cells differentiated from ESC are functional hematopoietic progenitors.
(A) Colony morphology upon 14 days of methylcellulose culture. Erythroid CFU (upper panels) and myeloid CFU (lower panels) are shown (initial magnification ×100). (B) CFU frequencies of CB34+, ES34+ and ES34−. Overall frequencies (left panel) of CB and ESC-derived cells, and a close-up of ES34+ and ES34− frequencies (right panel) displayed with an enlarged scale to help reading are depicted. Grey columns represent erythroids and white columns, myeloids. Bars are SD's. n = 8, 12 and 5 for CB, ES34+ and ES34− respectively. (C) FACS analysis of cells recovered after the CFU assay derived from CB34+ (upper panels) and ES34+ (lower panels). Myeloid (CD45, CD11b, CD14) and erythroid (GPA) cell surface markers are depicted. Quadrants were established using appropriate isotype controls and percentages are indicated. (D) Qualitative analysis of embryonic (ε), fetal (γ) and adult (β) globin mRNAs expression by RT-PCR of cell suspensions recovered after the CFU assays, derived from the indicated populations.

