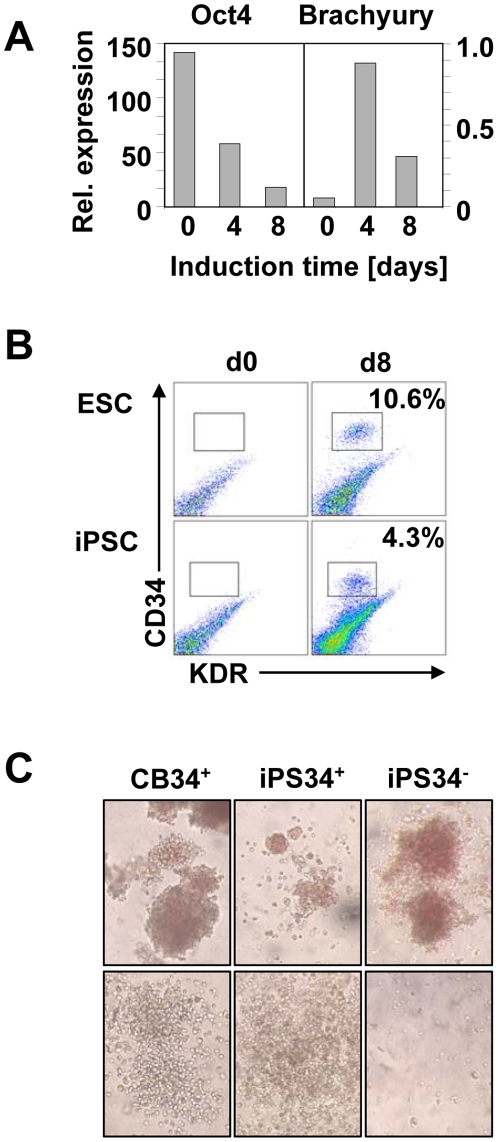
Figure 3. Hematopoietic differentiation of human iPSC.
(A) Oct-4 and Brachyury mRNA expression were assessed by quantitative PCR at the onset of the differentiation (d0), and 4 (d4) and 8 (d8) days later. The expression of the Gus-B housekeeping gene was used for normalization (representative data of 3 experiments). (B) CD34 and KDR expression was assessed by flow cytometry. ESC are shown in the upper panels and iPSC in the lower panels. Expression prior to differentiation (d0, left panel) and after 8 days (d8, right panel) is depicted. (C) CFU morphology was assessed upon 14 days of methylcellulose culture of iPSC-derived cells. Erythroid CFUs (upper panels) and myeloid CFUs (lower panels) were observed in these cultures and CB-derived cells are shown (initial magnification ×100).

