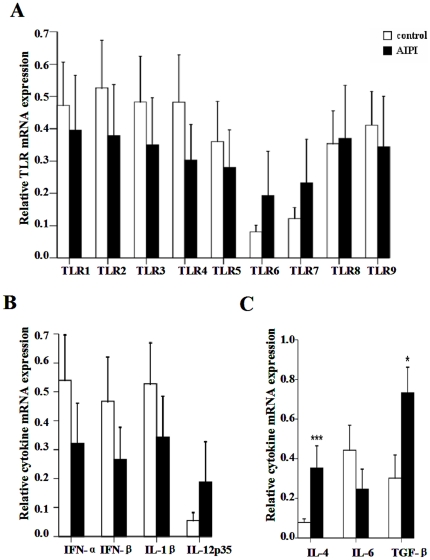
Figure 3. TLR and cytokine mRNA expression in lung of rats from control group and AIPI group.
TLR1-9 mRNA expression (A), IFN-α, IFN-β, IL-1β, IL-12p35 mRNA expression (B) and IL-4, TGF-β, IL-6 mRNA expression (C) were measured by QPCR. The rats in AIPI group were sensitized and challenged with OVA, while the rats of control group was administrated PBS. Results show as mean ±SEM from 10 rats in each group. *P<0.05; ***P<0.001; significantly different from control group.

