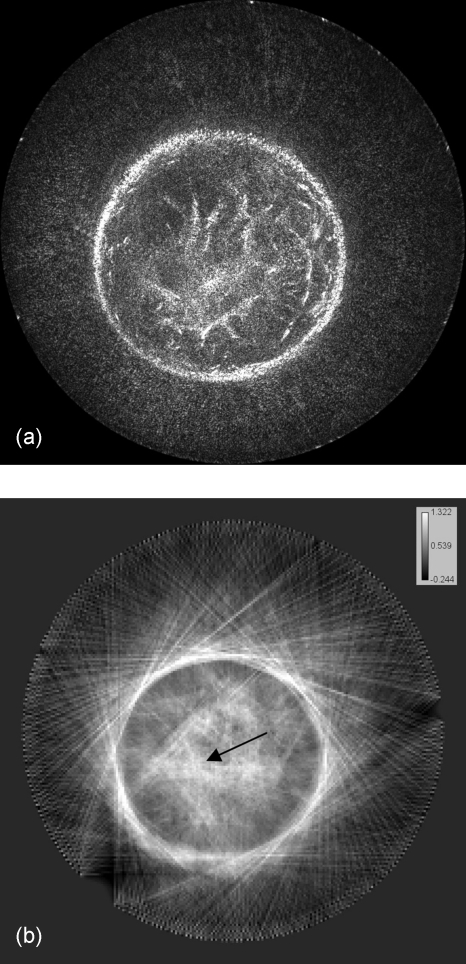
Figure 15.
Results of attenuation compensation (for the second case study), which helps enhance the signal to the center of the image. Image (a) was reconstructed using image (b) as a variable attenuation model. The attenuation image (b) was developed using the method described in Ref. 13. The attenuation values are represented in dB∕cm.

