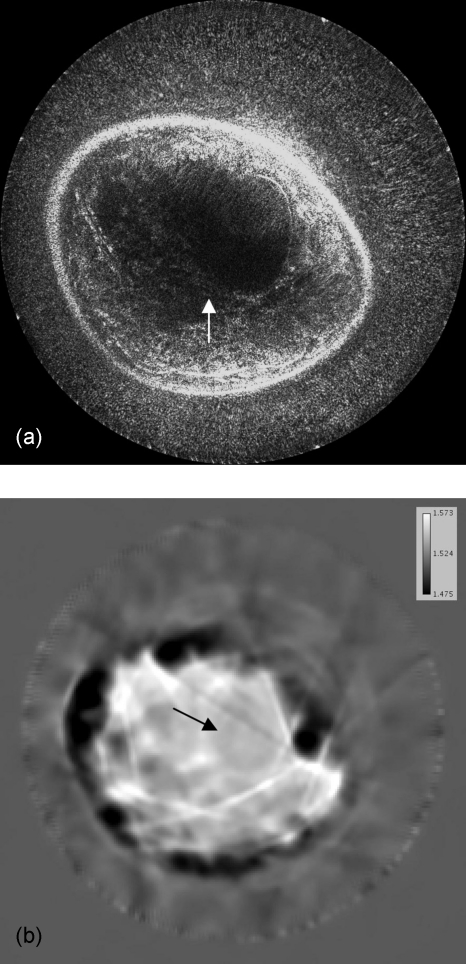
Figure 7.
Image reconstruction with the use of a sound speed model for more accurately calculated travel times. Note the focusing and contrast enhancement of edges in the resulted image of (a). Overall interference effects are more accurately superimposed and the structures become coherent as in the location indicated by the arrow. The sound speed image (b) used for this reconstruction was obtained by using the algorithms described in Ref. 14. The sound speed values are represented in km∕s. The arrow in (b) again indicates the position of the mass.

