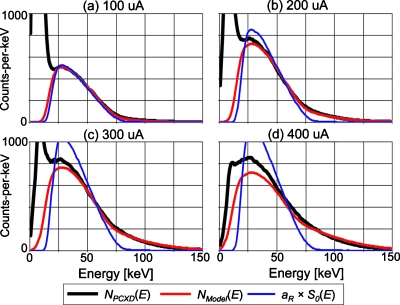
Figure 9.
The following three energy spectra for a tube setting of 80 kVp are shown: the mean energy spectrum measured by all of the comparators of DXMCT-1 (labeled NPCXD[E] in the figure); the energy spectrum predicted by the model of the spectral distortion caused by pulse pileup effects with the paralyzable detection model (labeled NModel[E]); and the scaled incident spectrum, aR×S0(E). The estimated incident count rate and deadtime loss ratio under the four tube current settings were 2.0 Mcps∕mm2 and 19% loss at 100 μA, 5.1 Mcps∕mm2 and 34% loss at 200 μA, 7.6 Mcps∕mm2 and 46% loss at 300 μA, and 10.1 Mcps∕mm2 and 56% loss at 400 μA.

