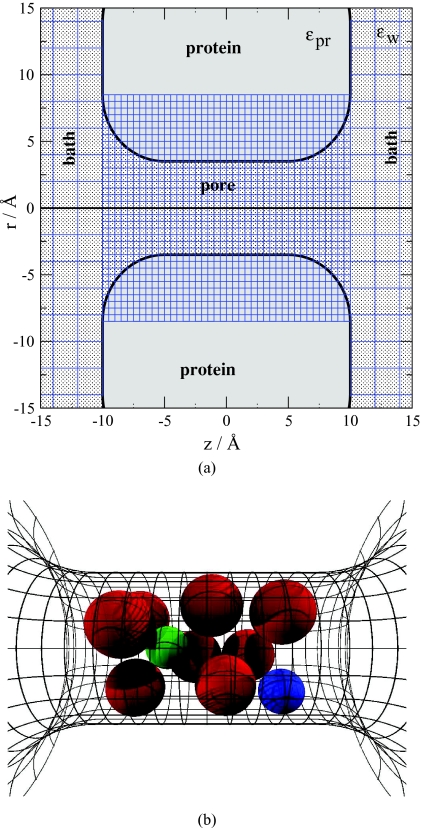
Figure 1.
Model of ion channel, membrane, and electrolyte. The three-dimensional geometry (B) is obtained by rotating the two-dimensional shape shown in panel a around the z-axis. The simulation cell is much larger than shown in the figure. The blue lines represent the grid over which the EXCP profiles are computed. The grid is finer inside the channel (width 0.5 Å), while it is coarser outside the channel (width 2 Å). The selectivity filter (|z| < 5 Å) contains eight half-charged oxygen ions O1∕2 − (red spheres in panel b). Green and blue spheres represent Na+ and Ca2 + ions, respectively. For the radii of the ions, the Pauling radii are used: 0.6, 0.95, 1.33, 0.99, 1.35, 1.81, and 1.4 Å for Li+, Na+, K+, Ca2 +, Ba2 +, Cl−, and O1∕2 −, respectively.

