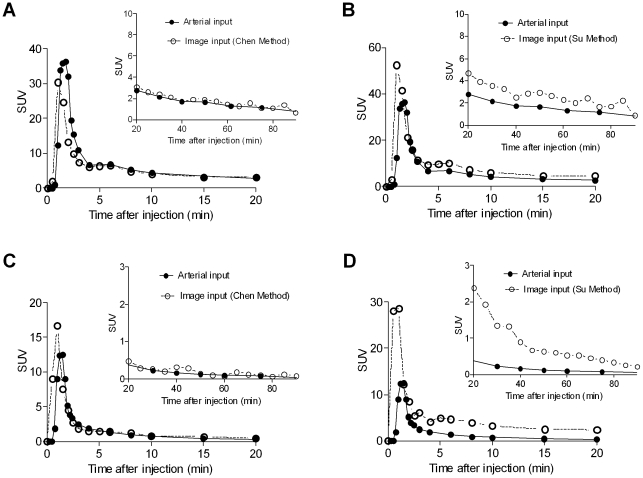
Figure 3. The concentrations over time of [11C](R)-rolipram (A and B) and [11C]PBR28 (C and D) in plasma from the arterial input function (solid line) and from the image input function (dashed line) of a representative healthy subject.
The curves are representative of those from a blood-based (Chen; A and C) and a blood-free (Su; B and D). None of the methods precisely estimated the peak in all the subjects but, in general, blood-based methods yielded a better estimate of the tails of the curves.

