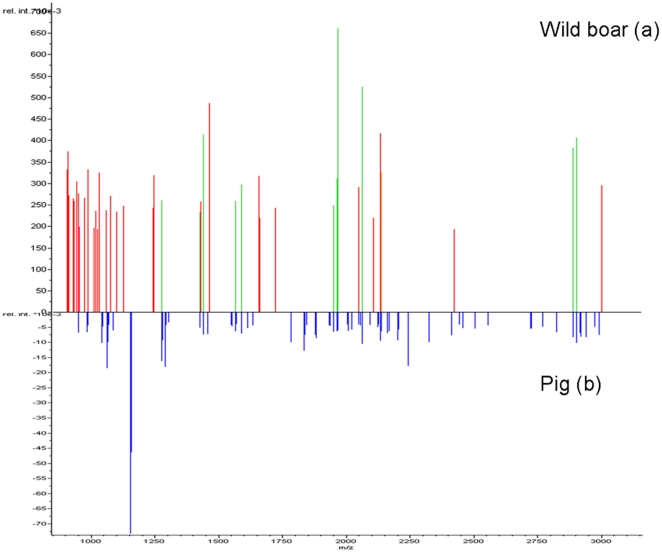
Figure 3. MALDI-TOF MS peptide profiling of proteins extracted from dental pulp.
Pseudo-gel displays (Gel View, Bruker Daltonics) of the peptide spectra obtained with wild boar (a) and pig (b) specimens were used as the reference peptide. The mass-to-charge ratio (m/z) of each peptide is indicated on the x-axis, and the relative intensity of each peak is shown on the y-axis. Blue bars correspond to peaks from pig specimens, red bars correspond to peaks from wild boar specimens, and green bars represent peaks shared by both.

