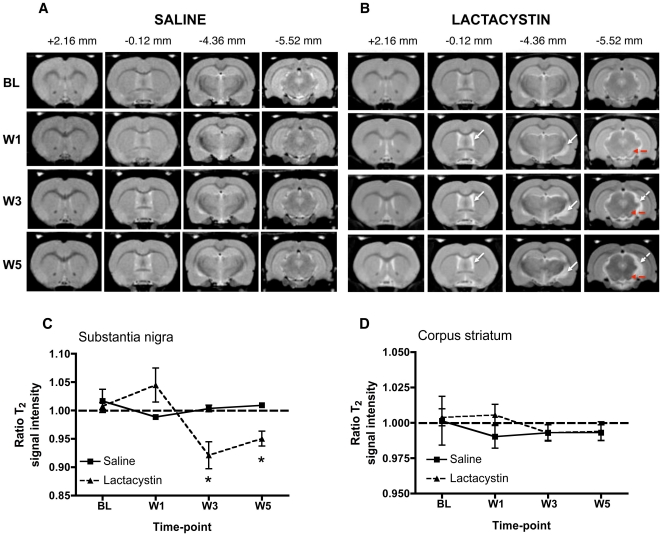
Figure 3. Representative longitudinal in vivo T2W MR images acquired from (A) saline-injected controls and (B) lactacystin-lesioned animals.
MR images are shown at four coronal levels (approximate distances from bregma are shown in mm). Note the absence of visible pathological changes in saline injected controls. By contrast, in lesioned animals hypertrophy of the lateral ventricles and deformation of the ventral midbrain with concomitant increase in CSF space (dashed arrows in B) may be observed post-lesion. Apparent contrast changes were also present in the area of the substantia nigra (solid arrows in B) with time. (C) No significant alteration in T2 signal intensity was observed at any time-point between groups in the striatum. (D) By contrast, a clear temporal evolution of changes in T2 signal intensity are apparent in the substantia nigra of lactacystin-lesioned animals compared to saline controls, ranging from hyperintense signal at wk 1 to hypointense signal at wk 3 and wk 5. Data shown are the mean ratio of T2 signal intensity between the contralateral non-injected and ipsilateral injected brain hemispheres in each group ± SEM. *p<0.05; saline (N = 5) vs. lactacystin (N = 7).

