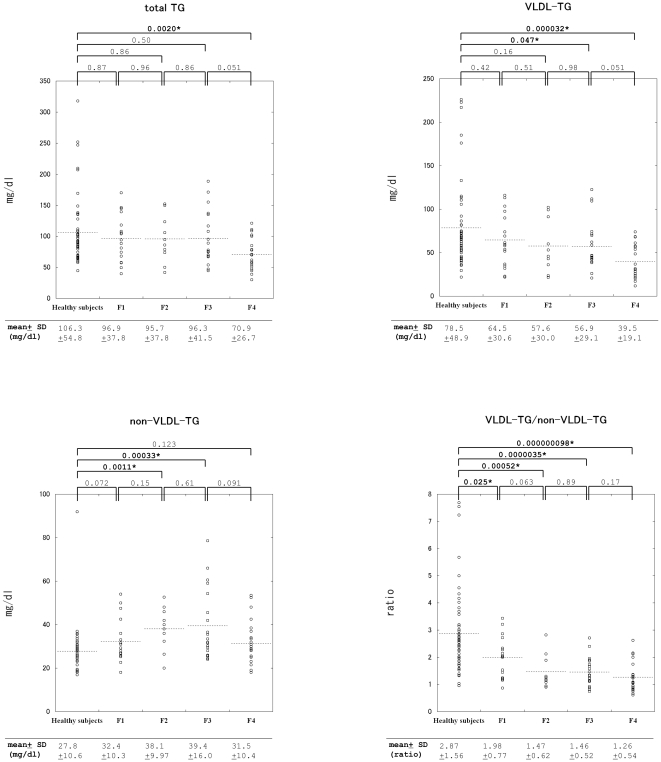
Figure 1. Scatter plots of serum total TG, VLDL-TG, non-VLDL-TG levels, and VLDL-TG/non-VLDL-TG ratios.
P-values are indicated as the values between groups with bars. The mean value of each group is indicated at the bottom of each diagram. P-values, when indicated in bold with an asterisk (such as 0.025*), indicate significant differences. SD; standard deviation.

