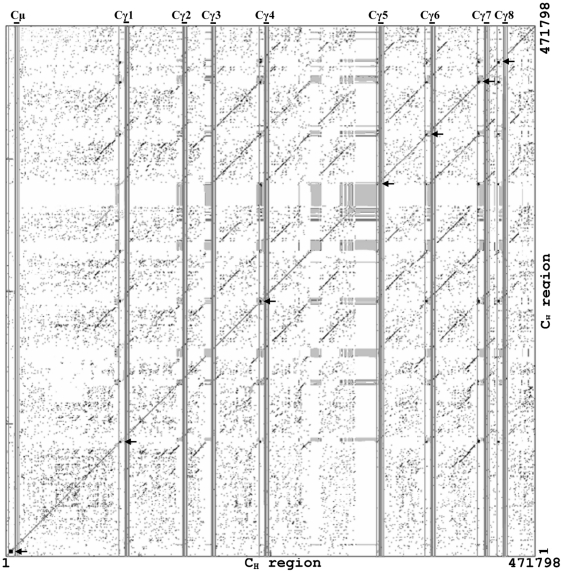
Figure 4. Dot plot comparison of the elephant CH (μ and γ) region.
A dot matrix representing repetitive sequences of elephant CH (μ and γ) genes. Switch regions are indicated by black-squared boxes and marked with arrowheads, and gaps are indicated by grey-squared boxes. Positions of CH genes are indicated as vertical lines. The dots represent homologies with a search length of 30 bp and maximum of 9 bp mismatches.

