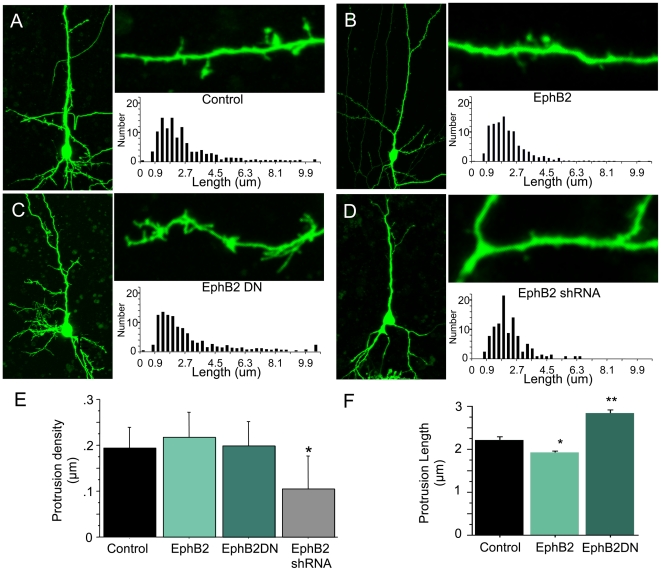
Figure 2. Alterations in EphB2 signaling and expression control dendritic protrusion length in brain slice culture.
A. Example of 4DIV layer 2/3 control cortical neuron in brain slice culture transfected with EGFP. Images collected with a two-photon microscope Leica TSP-2 and z-stack generated using NIH ImageJ. Adjacent, a high magnification view of a segment of dendrite containing both spines and filopodia. Graph shows distribution of lengths of protrusions in control neurons. B. As in A, but cortical neuron transfected with EGFP and wild type EphB2 expression constructs. Quantification indicates an increased proportion of shorter protrusions. C. As in A, but cortical neuron transfected with EGFP and EphB2DN expression constructs. Quantification indicates an increased proportion of longer protrusions. D. As in A, but cortical neuron transfected with shRNA targeting EphB2. Quantification indicates an overall decrease in protrusion number. E. Quantification of the overall density of protrusions in analyzed neurons (Control n = 19, EphB2 n = 17, EphB2DN n = 15, EphB2shRNA n = 7 neurons). F. Quantification of the overall length of dendritic protrusions in Control (n = 654 protrusions), EphB2 (n = 1141), and EphB2DN (n = 750). Error bars indicate standard error. *p<0.005, ** p<0.001.

