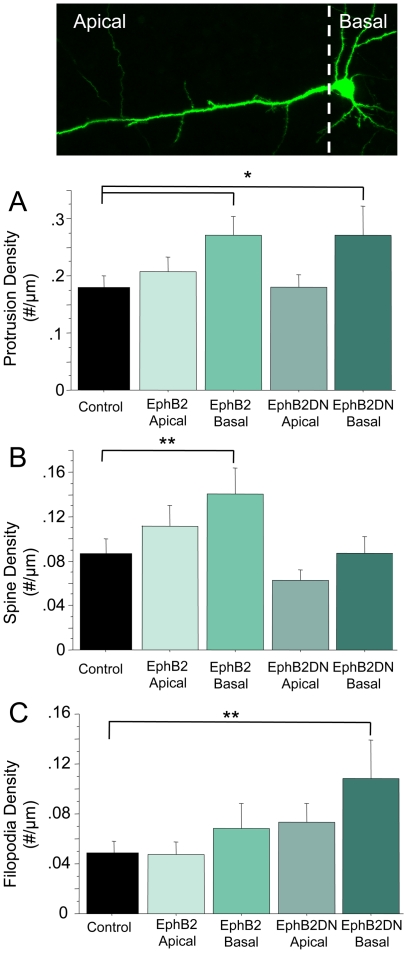
Figure 4. Preferential effect on protrusion structure in basal dendrites with overexpression of wild type or mutant EphB2.
Top: Sample image of GFP-expressing cortical neuron in brain slice showing apical and basal portions of dendritic tree. A. Quantification of density of classifiable protrusions in the apical or basal portions of neurons transfected with the indicated construct. B. Quantification of spine density in the apical or basal portions of neurons transfected with the indicated construct. C. Quantification of filopodia density in the apical or basal portions of neurons transfected with the indicated construct. Control: n = 18 neurons; EphB2, apical and basal: n = 16 neurons; EphB2DN, apical and basal: n = 15 neurons; Error bars indicate standard error. Scale bar = 2 µm; *p<0.05. **p<0.03.

