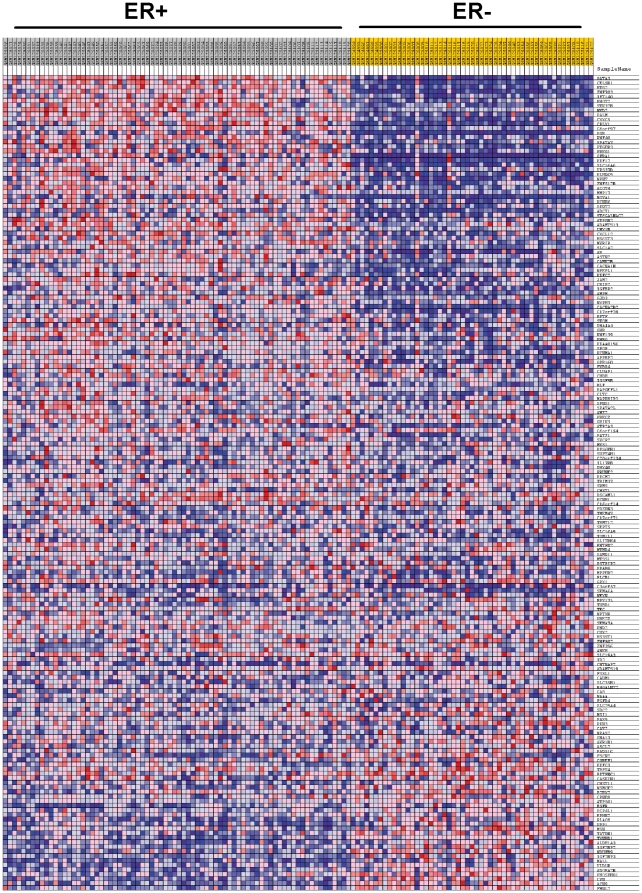
Figure 6. Expression of focus genes from cellular analyses in primary human breast cancer.
The heatmap was generated from GSEA analysis in which microarray data from 76 ER+ and 53 ER− tumors were interrogated with a geneset consisting of 149 genes that were differentially expressed and inversely methylated plus 30 genes that were overexpressed in ER+ cells and amplified in ER+ cells or deleted in ER− cells.

