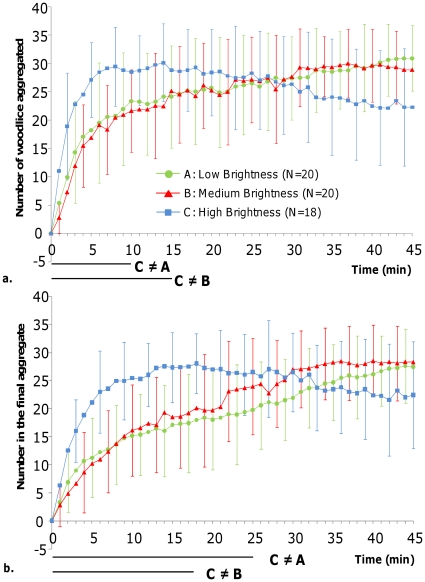
Figure 3. Comparison of dynamics of aggregation in homogeneous set ups.
Dynamics were observed in arenas under low, medium, or high brightness corresponding to experimental conditions A, B, and C. a: total population of aggregated woodlice; b: woodlice aggregated in the final aggregate. Standard deviations are presented for each 3 minutes. The bottom part of the graphic represents the statistical differences obtained minute per minute using Dunn's test, p<0.05: lines show differences.

