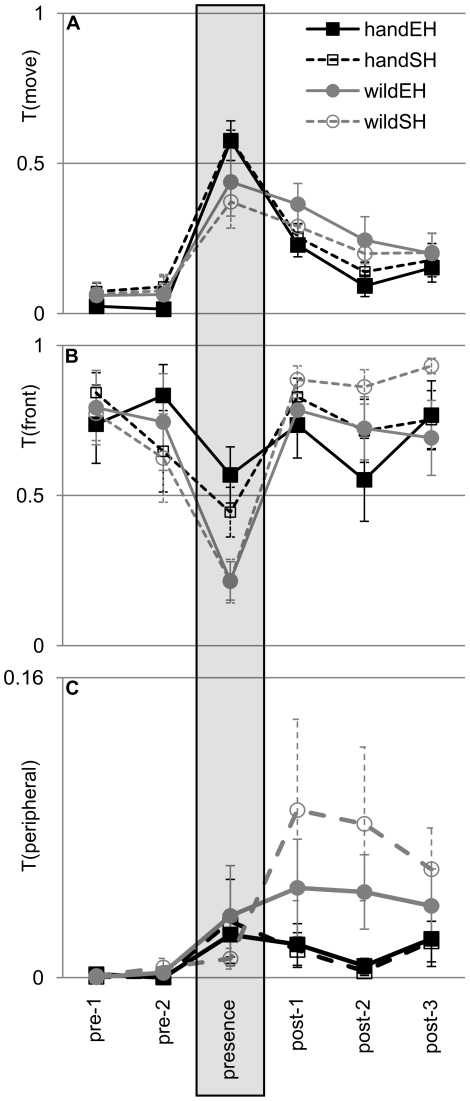
Figure 2. Response to a human.
Effect of origin and housing on (A) general activity T(move), (B) use of front section of cage T(front), and (C) use of peripheral cage locations T(peripheral). Shown is the behaviour over the course of 6 consecutive time periods of 255 sec duration each. The grey shaded box indicates the period when the human was present. Pre-1 and pre-2: periods before the human entered the room; post-1, post-2 and post-3: periods after the human had left. Black squares: hand-reared birds; grey circles: wild-caught birds; filled symbols, solid lines: enriched housing (EH); open symbols, dashed lines: non-enriched housing (SH). Shown data values are not transformed but normalized to the length of the time period (thus, a value of 1(100%) is equivalent to 255 sec, and a value of 0.5 (50%) to 127.5 sec). Data show group means ±1 SEM.

