Figure 2.

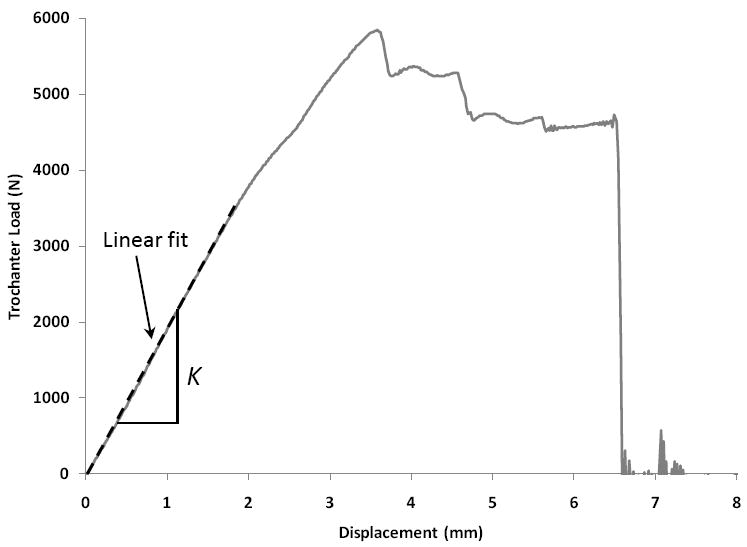
Representative force-displacement curve of a femur with normal aBMD. Trochanter load is plotted versus femoral head displacement. The slope of the linear elastic part of the curve is measured as the overall femoral stiffness.

Representative force-displacement curve of a femur with normal aBMD. Trochanter load is plotted versus femoral head displacement. The slope of the linear elastic part of the curve is measured as the overall femoral stiffness.