Figure 8.

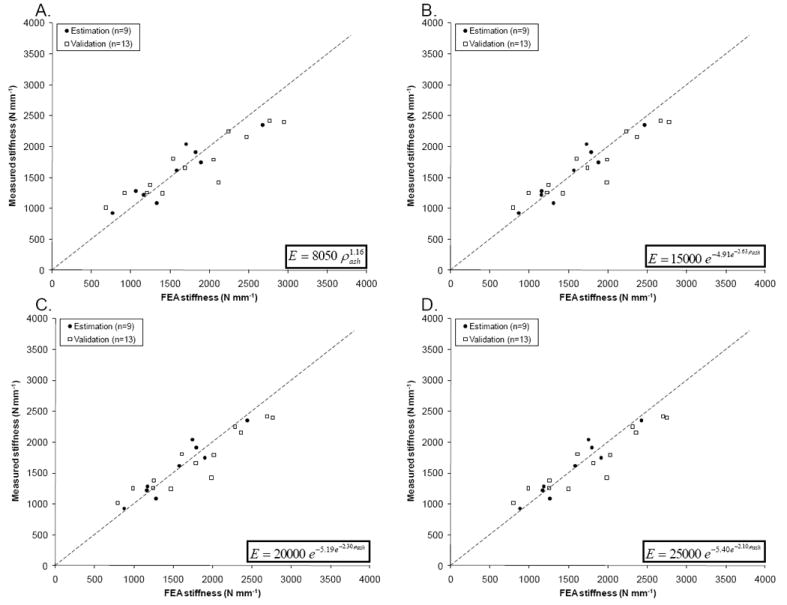
Measured vs. predicted stiffness for the estimation and the validation groups, based on the optimized power law (A), and sigmoid functions with Emax = 15 GPa (B), 20 GPa (C) and 25 GPa (D).

Measured vs. predicted stiffness for the estimation and the validation groups, based on the optimized power law (A), and sigmoid functions with Emax = 15 GPa (B), 20 GPa (C) and 25 GPa (D).