
Figure 2.
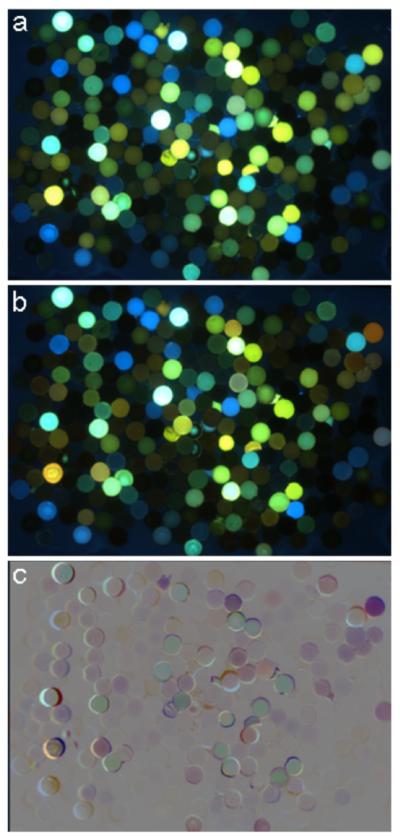
Examples of images from library screening for fluorescence responses. (a) Library in buffer alone and (b) in the presence of 100 μM AgNO3. To facilitate finding beads exhibiting fluorescence changes, image (a) was inverted and combined with (b) (50% blending) to produce difference image (c). In this difference image, 50% gray represents no change, while beads that are darker or lighter than gray show quenching and enhancement, respectively. Colors represent a combination of the original colors and the spectral shifts. Additional examples are given in the SI file.